MONITORING SOLUTIONS
Managed Systems Monitoring

Photon managed
systems monitoring
An expert monitoring service, deployed and delivered by monitoring experts.
Photon is a subscription service for engineering led, business aware and actionable monitoring of the full stack of critical systems and applications. It is provided on premise, in the cloud, or a hybrid of both. Photon is built on a common technology core that underpins Breakpoint’s expert monitoring solutions.

Photon’s benefits
Photon is an expert monitoring service, deployed and delivered by monitoring experts. It is fundamentally geared to address the reason why most monitoring investments fail to deliver returns. Photon relieves the operations (or worse, development) teams in an organisation from the responsibility of deploying and maintaining monitoring services to the organisation.
FOR operations teams
Faster deployment and time to insight
Better visibility and dashboards
More accurate thresholds
More reliable alerting
Minimal effort for maximum gain
FOR business
More reliable service because of improved capacity forecasting
More reliable service because of faster root cause analysis
Better utilisation of computing assets
ESSENTIAL FEATURES
Photon is a best-of-breed systems monitoring platform, with functionality that extends into the Application Performance Management (APM) space. As such, it offers all the elements you would expect from a monitoring system, but delivered in a way that lets you fully realise the benefits of monitoring.
Agent or SNMP based monitoring of nodes
13 months of data retention included as standard
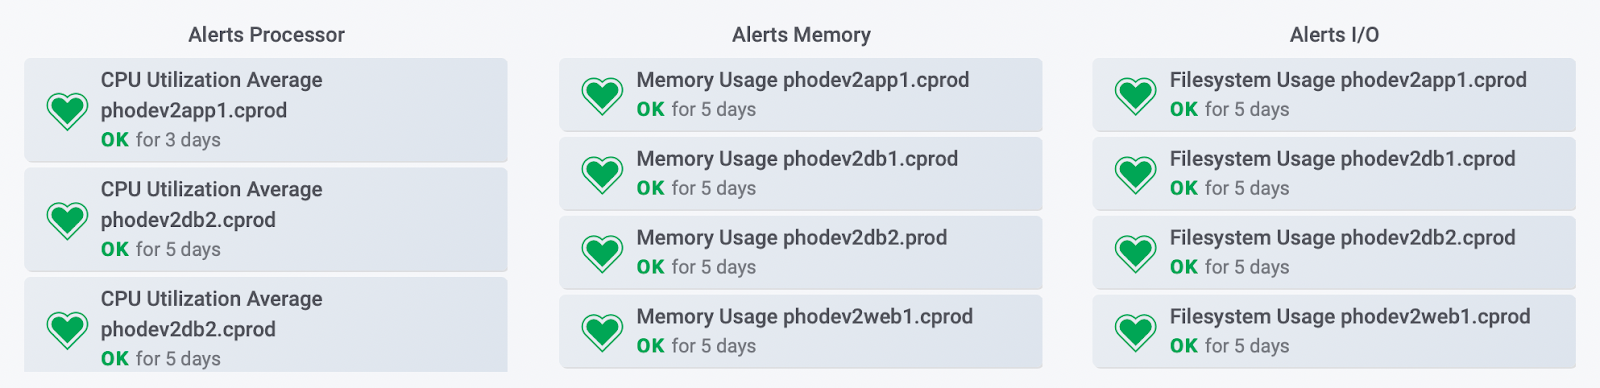
Alerting
Log Event Tracking
Managed Monthly Reports *
Incident Reports *
* Extra cost add-ons to the standard service offering
UNIQUE FEATURES
More often than not, the quality of any monitoring implementation gradually declines – and eventually fails completely – due to the general neglect of the critically important administrative tasks that are not being performed on a continuous basis. This occurs primarily due to a lack of skill and a lack of dedicated attention by monitoring experts.
Photon was conceived by Breakpoint engineers out of long term, first hand and deep experience with customers who have experienced these failures. It is geared to address this deficiency at a fundamental level, and therefore the Photon subscription also includes the following key elements:
Correlation and Integration with Analytics and Digital Experience Monitoring
Because Photon and the other services in Breakpoint’s Vantage suite share a common technology core for end-to-end service monitoring, it offers a single pane of glass view of your service landscape with monitoring using synthetics, analytics, real user monitoring and systems monitoring in an integrated manner. It is easy to create a dashboard that correlates the user experience with any available systems metric or complex business analytics.
Reliable Metric Collection and Ingestion
Photon is designed and built with robust mechanisms to deal with network interruptions or service disruptions, so that you don’t lose metrics. When the agent is not able to hand off metrics to the data store, it will buffer the metrics up to a configurable limit. An additional caching mechanism on the VantageD collector, which is deployed in close proximity to the monitored nodes, ensures highly reliable metric delivery for your critical or time sensitive applications.
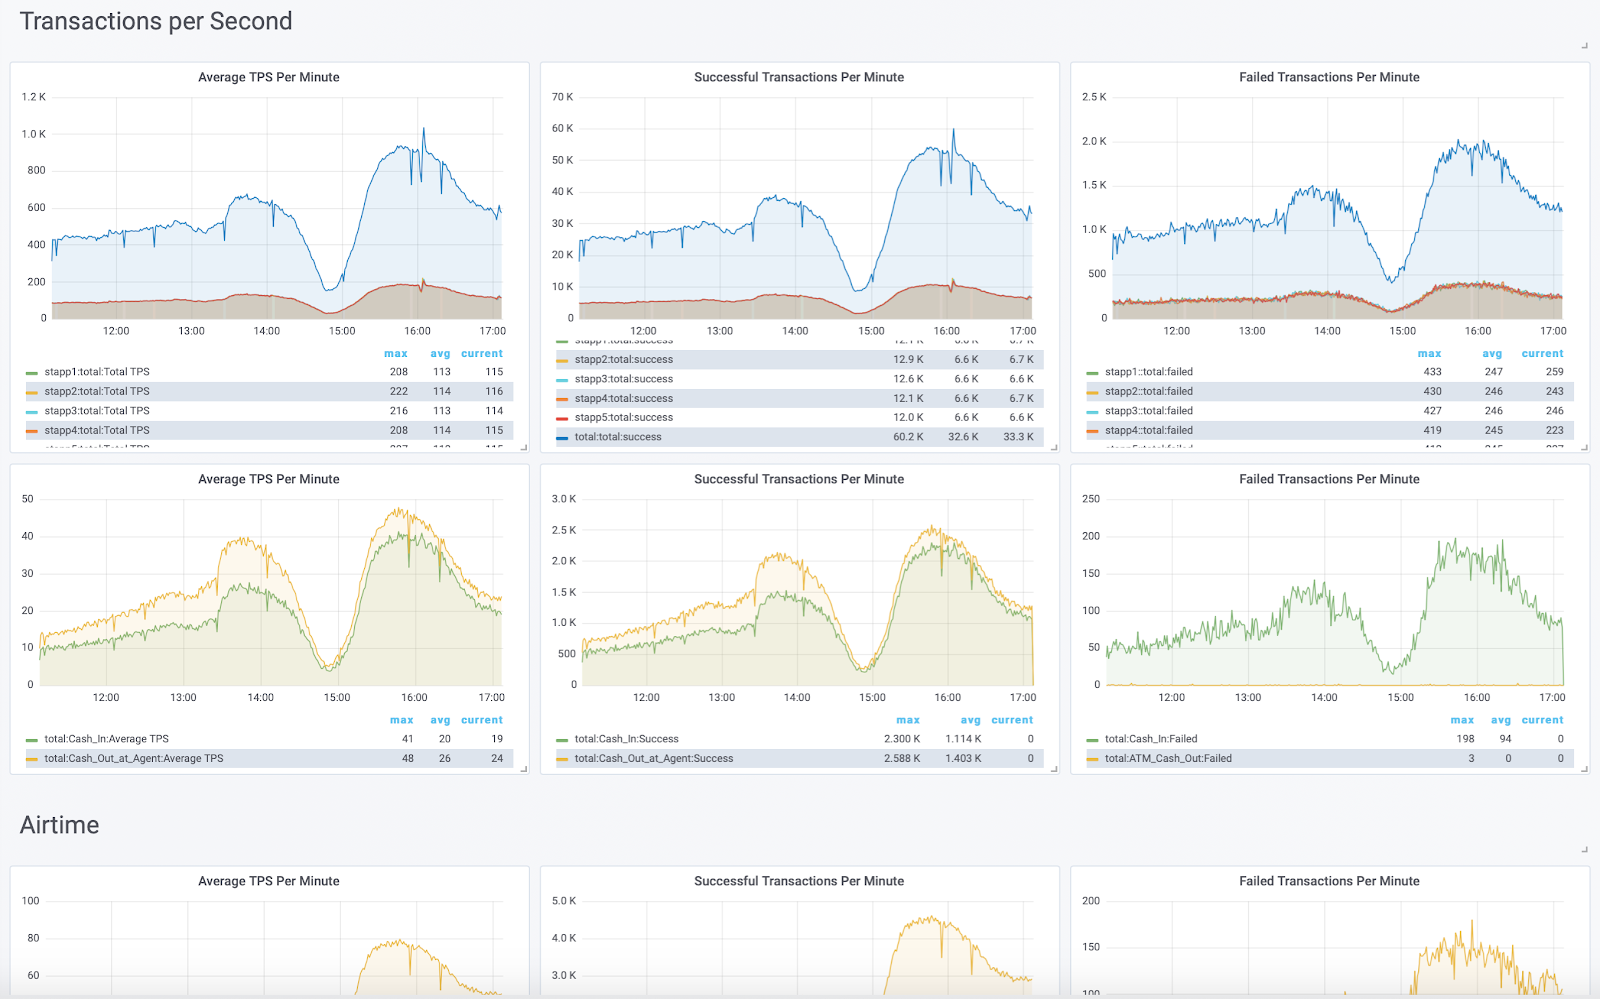
High Resolution Metrics
Most of the leading monitoring solutions provide at best one minute resolution, which is insufficient resolution for troubleshooting highly volatile or transient application or infrastructure issues. Photon is able to provide up to 10 second resolution for nearly all available metrics, along with reliable ingestion and visualisation of high velocity monitoring data.

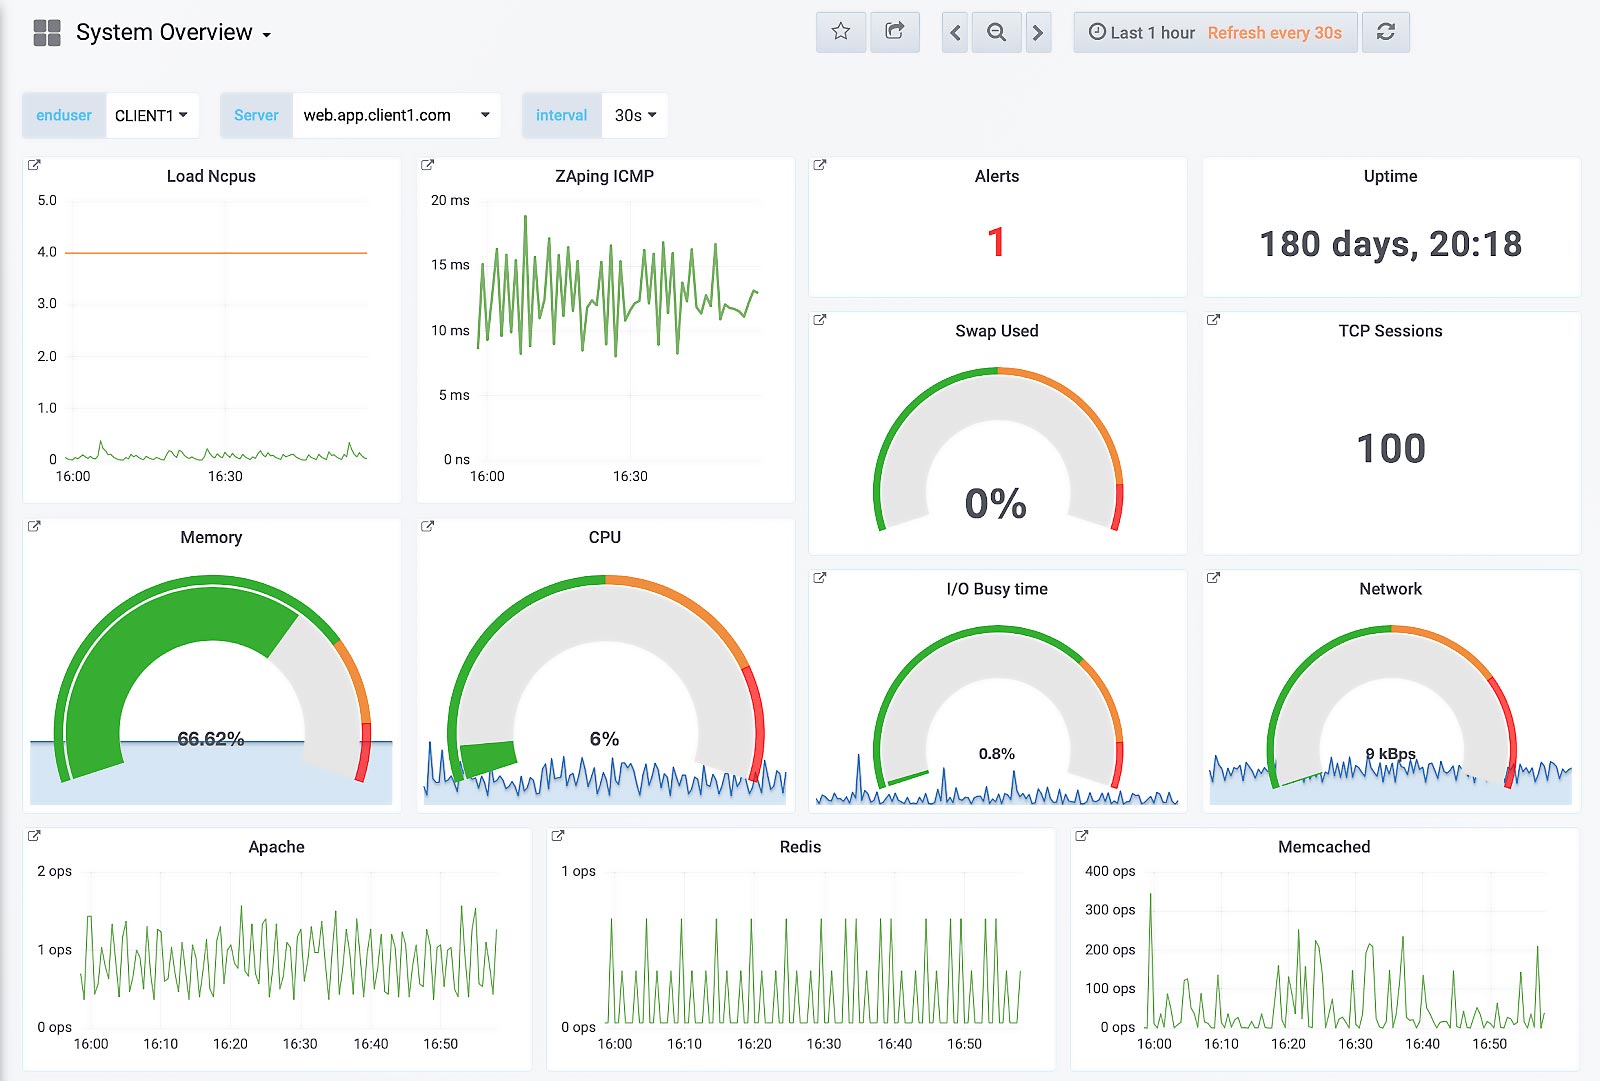
Managed Operational Dashboards
Collecting and storing metrics are only half of the solution. One has to present these metrics in a meaningful and easy to interpret manner in order to make the data useful. Part of our service is for our experts to build out the real-time dashboards required to visualise monitoring data for various stakeholders according to their needs, and to maintain these dashboards on an ongoing basis with new or changing requirements.

Managed Reporting Dashboards
Real time, operational needs are different from reporting needs, which focus more on long term trends, forecasts and capacity planning elements. Our systems expertise, combined with data analysis and visualisation skills, means we know what data to look at in order to inform capacity planning and forecasting needs.

Managed Monitoring Environment
Monitoring environments are complex and data rich, and as such they require careful management and maintenance in order to perform reliably and optimally. Moreover, monitored environments are almost never static. This part of our service ensures that the databases, software stacks, systems and agents are optimally configured, maintained and updated. We also add and remove nodes that are introduced or decommissioned. This good hygiene and housekeeping ensures continued optimal output from your monitoring investment.
Managed Custom Integrations
Standard, out of the box monitoring is almost never sufficient when it comes to optimising application performance, or troubleshooting performance or reliability issues. However, building out visibility and insights into the more esoteric aspects of app or infrastructure issues can be incredibly difficult. Our experienced team is able to work with our customers and their application vendors to provide instrumentation and hooks into applications, or read from any exposed interface or log file, in order to extract and visualise the necessary data for monitoring purposes.
Managed Thresholds
A common failure of monitoring deployments relate to improper implementation of alert thresholds – not getting alerts for critical conditions means that impactful conditions get overlooked. Even worse, too many alerts could lead to fatigue and a low signal-to-noise ratio, which means that serious problems get lost in the noise. Our team is dedicated to having the finger on the pulse, and are constantly tuning thresholds based on observed baselines and system behaviour, informed by service quality metrics.
deployment modalities
Photon is offered in three tiers, depending on customer requirements. The tiers are Basic, which aims to provide essential dashboards using standard metrics for operations personnel, Standard which adds full alerting and custom monitoring capabilities, and Managed, which is monitoring as a service that requires almost no effort from you.
Photon relies on an agent deployed on monitored nodes for reliable collection and delivery of metrics. The agent is a light weight, single binary that supports Linux and Windows platforms. In the event that agents can not be deployed on a host, Photon can collect metrics using industry standard interfaces such as SNMP.
In the cloud
In this mode, you are required to deploy a virtual appliance that we supply on your infrastructure (one in each datacenter where you have monitored nodes), and to open HTTPS traffic outbound from this appliance to a single address in the cloud for metric ingestion. Your dashboards are hosted by us and you access your dashboards via web browser. Alerts are dispatched from Photon to the cloud based integration of your choice
On premise
For hosting Photon on premise, you need to provide four server instances (two databases and two front end servers), as well as a virtual appliance in each datacenter where you have monitored nodes. Our team will take care of managing the environment over site to site VPN
A hybrid of both cloud and on premise
In this mode, your primary means of operation is as with the cloud model, but with the on premise component providing a local hot standby instance containing only the short term monitoring data. In an emergency, this provides a local fallback in case of network failures between your environment and the cloud, so that you have continuous visibility.

The deployment of the Photon platform and all agents are conducted as part of our service, with the assistance of your personnel where required.
All metric flow and communications are secured by industry standard TLS encryption, and all authorisation between agents and Photon servers are securely tokenized.
Metrics supported by Photon
View Applications/Services Supported
| activemq | dovecot | jti_openconfig_telemetry | nginx_plus | salesforce | |
| aerospike | ecs | kafka_consumer | nginx_plus_api | sensors | |
| all | elasticsearch | kafka_consumer_legacy | nginx_upstream_check | smart | |
| amqp_consumer | exec | kapacitor | nginx_vts | snmp | |
| apache | fail2ban | kernel | nsq | snmp_legacy | |
| aurora | fibaro | kernel_vmstat | nsq_consumer | socket_listener | |
| bcache | file | kibana | nstat | solr | |
| beanstalkd | filecount | kinesis_consumer | ntpq | sqlserver | |
| bind | filestat | kube_inventory | nvidia_smi | stackdriver | |
| bond | fluentd | kubernetes | openldap | statsd | |
| burrow | github | leofs | opensmtpd | swap | |
| cassandra | graylog | linux_sysctl_fs | passenger | syslog | |
| ceph | haproxy | logparser | pf | sysstat | |
| cgroup | hddtemp | lustre2 | pgbouncer | system | |
| chrony | http | mailchimp | phpfpm | tail | |
| cloud_pubsub | http_listener_v2 | mcrouter | ping | tcp_listener | |
| cloud_pubsub_push | http_response | mem | postfix | teamspeak | |
| cloudwatch | httpjson | memcached | postgresql | temp | |
| conntrack | icinga2 | mesos | postgresql_extensible | tengine | |
| consul | influxdb | minecraft | powerdns | tomcat | |
| couchbase | influxdb_listener | mongodb | powerdns_recursor | trig | |
| couchdb | internal | mqtt_consumer | processes | twemproxy | |
| cpu | interrupts | multifile | procstat | udp_listener | |
| dcos | ipmi_sensor | mysql | prometheus | unbound | |
| disk | ipset | nats | puppetagent | varnish | |
| diskio | iptables | nats_consumer | rabbitmq | vsphere | |
| disque | ipvs | neptune_apex | raindrops | webhooks | |
| dmcache | jenkins | net | redis | win_perf_counters | |
| dns_query | jolokia | net_response | rethinkdb | win_services | |
| docker | jolokia2 | nginx | riak | wireless |
Alert integrations supported by Photon
Photon supports many notification channels for alerts, and it can be integrated to your bespoke or existing notification or ticketing systems by our team, using email, SMS or webhook integrations.
View Alert Intergrations Supported
| Name | Type | Supports images |
| DingDing | dingding | yes, external only |
| Discord | discord | yes |
| yes | ||
| Google Hangouts Chat | googlechat | yes, external only |
| Hipchat | hipchat | yes, external only |
| Kafka | kafka | yes, external only |
| Line | line | yes, external only |
| Microsoft Teams | teams | yes, external only |
| OpsGenie | opsgenie | yes, external only |
| Pagerduty | pagerduty | yes, external only |
| Prometheus Alertmanager | prometheus-alertmanager | yes, external only |
| Pushover | pushover | yes |
| Sensu | sensu | yes, external only |
| Slack | slack | yes |
| Telegram | telegram | yes |
| Threema | threema | yes, external only |
| VictorOps | victorops | yes, external only |
| Webhook | webhook | yes, external only |
Ready to get started?
Get in touch to find out more about our range of solutions and supporting services.