MONITORING SOLUTIONS
Charging System Monitoring

ALLUVIA Charging system monitoring
Breakpoint’s Alluvia Charging System Monitoring CSM is a cost effective next generation service for seamless coalescence of charging system data and events, coupled with synthetic probes, providing monitoring, alerting and visualisation of Key Performance Indicators for charging systems. With the use of Near Real-time Analytics, which is the analysis of data as soon as that data becomes available, combined with synthetic probes of the Charging System components, valuable near real-time insight into the Charging system is provided that allows conclusions to be drawn almost immediately after the data enters the system.

COST EFFECTIVE KPI MONITORING FOR TELCO CHARGING SYSTEMS
Breakpoint’s Alluvia Charging System Monitoring (CSM) is an integrated monitoring and analytics solution for telecommunications Charging systems. Telco Billing and Charging systems consist of complex integrations using many components, sometimes from different vendors. This makes it difficult to monitor this environment accurately and timeously. Alluvia CSM relies on non-invasive processing of streaming data combined with synthetic transaction injection to give objective, reliable and cost effective insight into the performance of the Charging system.
Key Advantages
Alluvia CSM provides valuable information about the performance and status of charging systems to senior management, operational management, administrators and operations teams, both in near real-time and historically. Alluvia is an extensible real time information platform that is vendor neutral and supports multi-vendor cross platform monitoring.
FEATURES & INSIGHTS
Alluvia CSM provides you with dashboards and alerts for the state of charging system components using synthetic probes.
KPIs are derived from charging system data streams that are collected non-invasively.
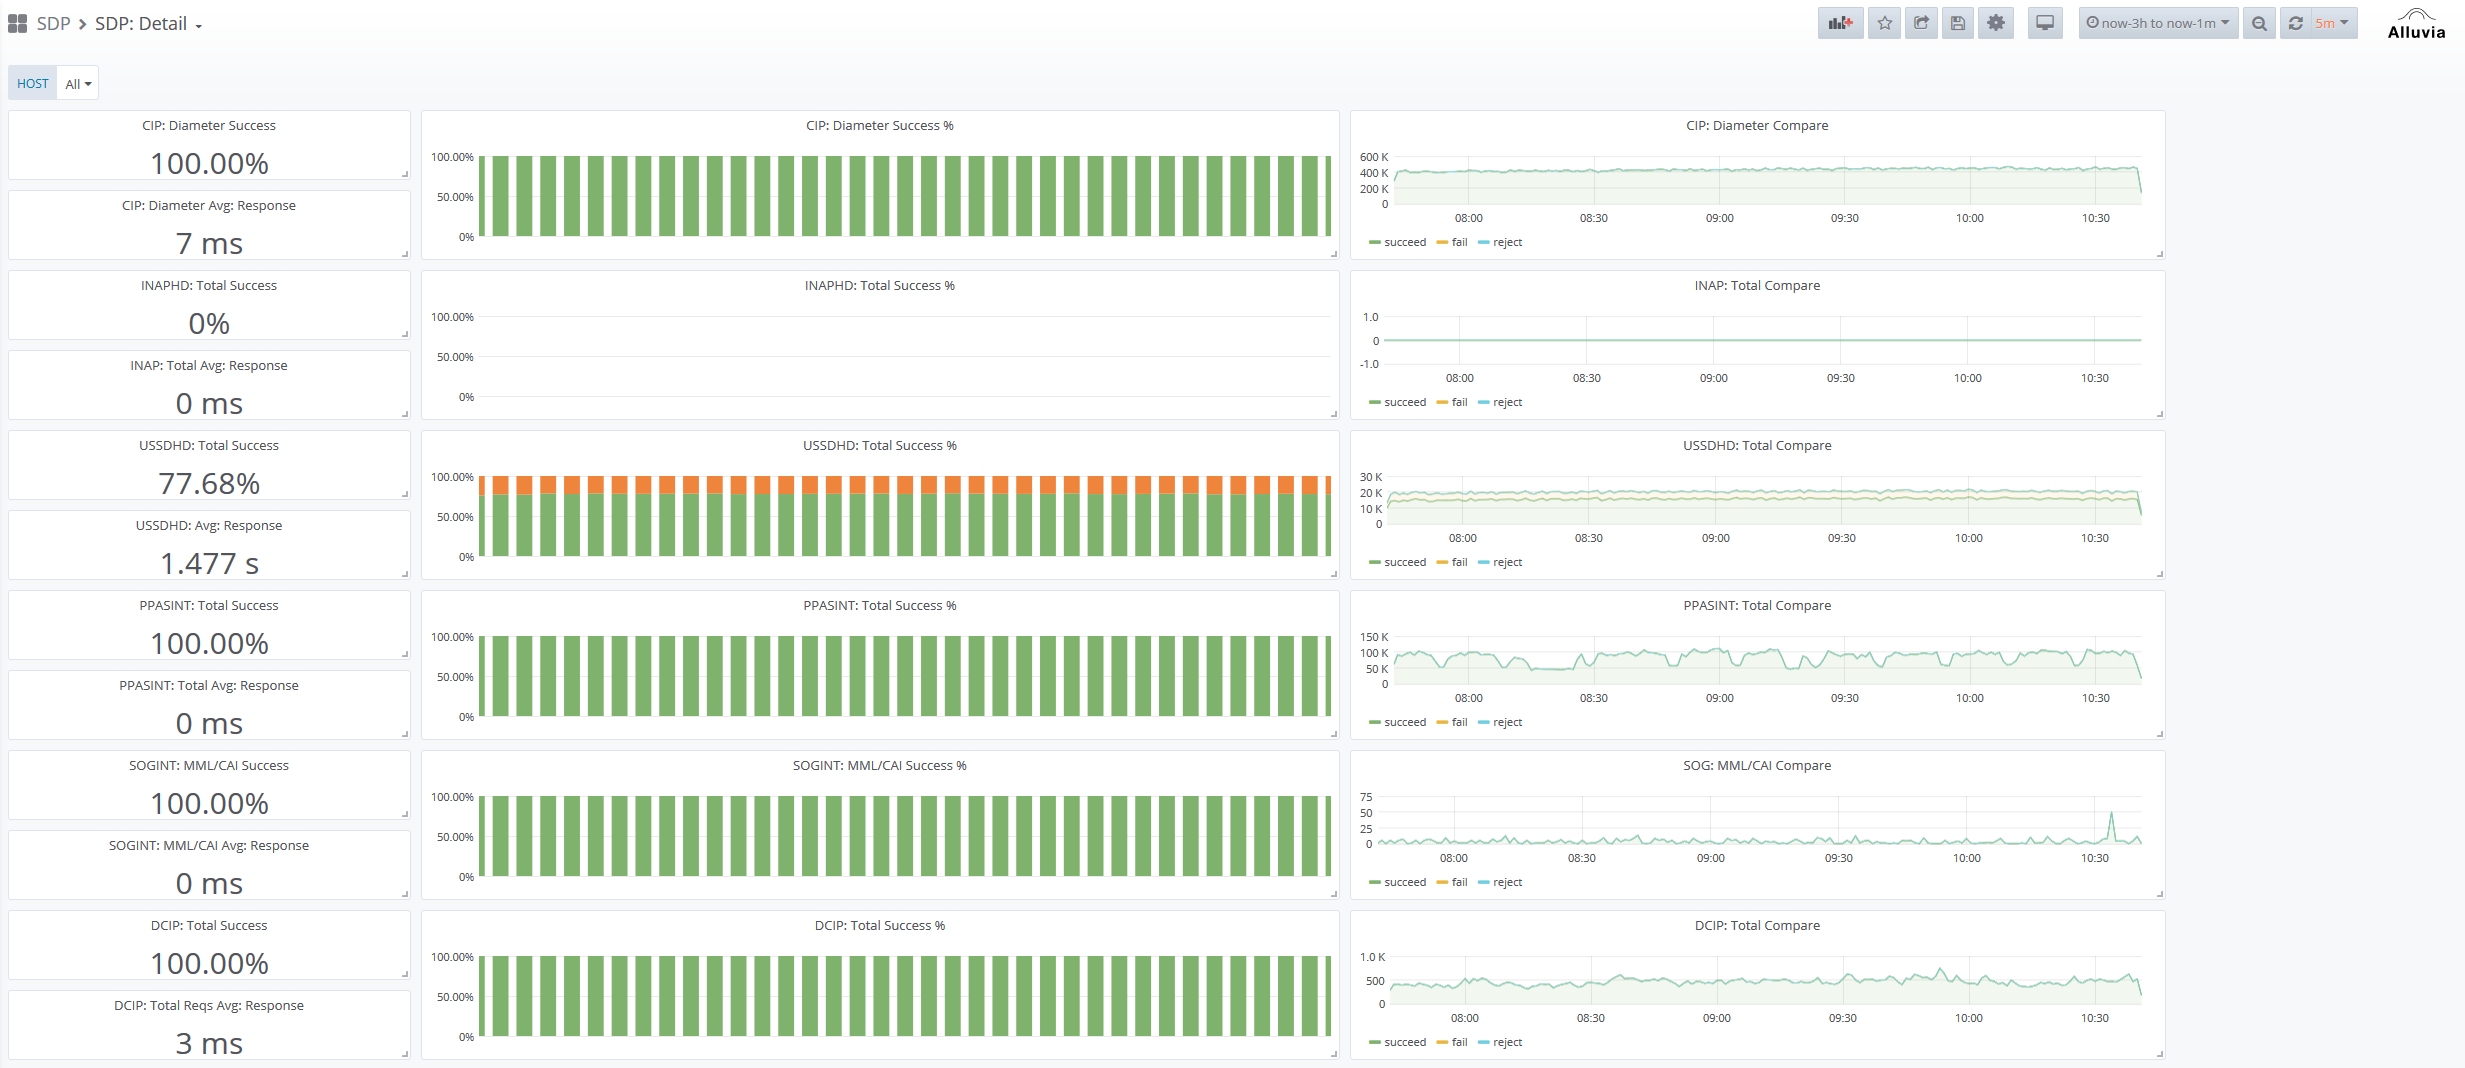
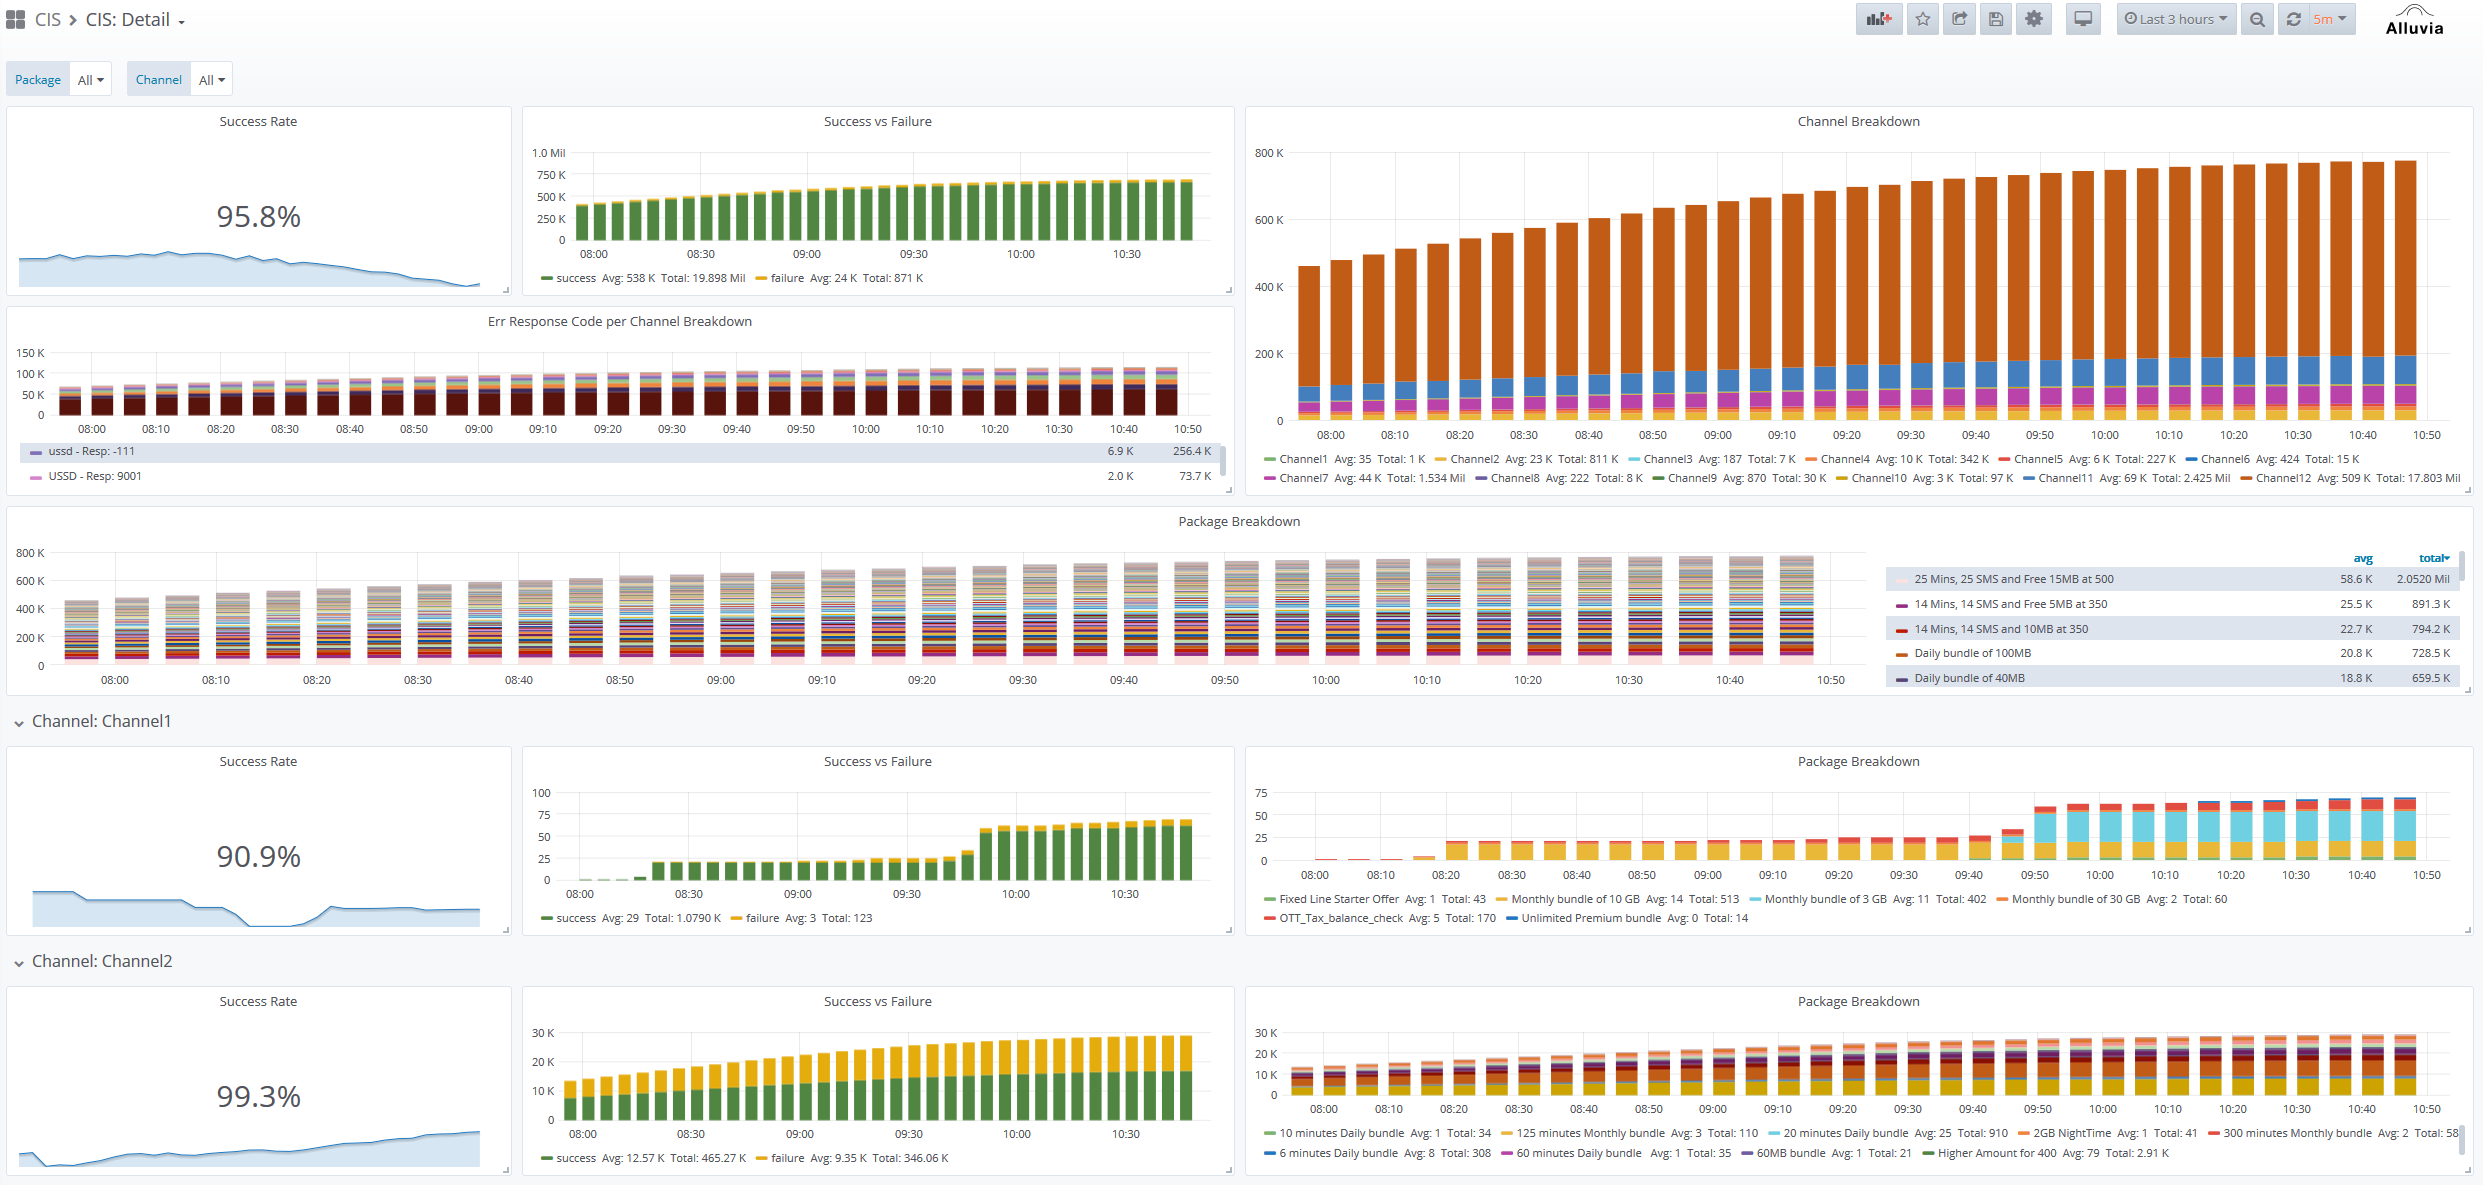
The combined synthetic probes and streaming data provide reliable, objective, end to end insight into the performance of your charging system in the form of highly customisable dashboards.
Health of AIR, CCN, OCN, SDP nodes, individually and collectively
Health checks by means of payload inspection and validation
Easy to read KPIs
Success Rates
Breakdowns per Transaction
Breakdowns per Channel
Comparative Errors - Throughput per System or Node
Complex Alert Conditions
Sample Dashboards
Ready to get started?
Get in touch to find out more about our range of solutions and supporting services.

